
Planning bumper car attraction revenue year one fec performance starts with a clear operating model.
Use the sections below to test capacity, demand, scheduling, and launch-year execution.
To estimate bumper car attraction revenue year one fec performance, start with operating assumptions rather than a universal industry average. An FEC owner needs to understand how many guests the attraction can serve and how often sessions can run. Demand also changes across the calendar. Account for that before treating year-one performance as a business case.
For the physical planning context behind those assumptions, review the Spin Zone Bumper Cars guide for commercial FEC operators.
To estimate bumper car attraction revenue year one fec operators can use a simple model: revenue per session multiplied by sessions per operating day, operating days, and a realistic utilization factor. Build conservative, base, and upside scenarios from your own schedule, capacity, staffing, downtime, and guest-demand assumptions rather than presenting any result as guaranteed.
Schedule Design Consultation for a site-specific capacity and revenue review.
That estimate should represent gross attraction revenue, not profit or total venue revenue. The most useful evaluation connects the model to the physical plan, including traffic flow, loading efficiency, available footprint, and the attraction’s role in the broader FEC. The following framework shows how to turn those operating details into a transparent first-year model.
What Should Bumper Car Attraction Revenue Year One FEC Planning Include?
There is no universal first-year revenue benchmark for a bumper car attraction. The right way to evaluate the opportunity is to build a transparent operating model around your site, schedule, audience, and sales assumptions. That approach gives an FEC owner a usable range for planning without turning an unverified estimate into a promise.
Start with gross ride revenue
Use this basic formula:
Gross ride revenue = revenue per session x sessions per operating day x operating days x utilization factor
Each input should come from your operating plan. Revenue per session may reflect the amount your facility assigns to one ride or participant session. Sessions per operating day should account for your planned operating hours, session length, loading and unloading, and the number of cars available. Operating days should reflect your actual calendar, including seasonal closures and reduced schedules. The utilization factor then adjusts theoretical capacity for demand, weather, staffing, downtime, maintenance, and periods when the attraction is open but not full.
- Capacity: cars, riders, arena footprint, and practical dispatch size.
- Availability: scheduled hours, operating days, charging, maintenance, and downtime.
- Demand: peak periods, ordinary periods, seasonality, and expected utilization.
- Measurement: sessions, riders, loading time, wait time, and actual revenue by daypart.
This distinction matters. A schedule can show substantial theoretical capacity while actual paid sessions vary significantly throughout the year. Weekends, school holidays, private events, and slower weekdays may each produce a different utilization pattern. Rather than applying one percentage to every day, consider modeling separate demand factors for peak, standard, and low-demand periods. The result is a range that better reflects how an attraction is likely to operate.
Use conservative, base, and upside scenarios
Build at least three versions of the model. The conservative scenario uses cautious utilization and accounts for ramp-up time, training, downtime, and slower early demand. The base scenario uses the schedule and demand assumptions you believe are most supportable. The upside scenario tests stronger utilization during peak periods, but it should still respect the attraction’s physical capacity, staffing plan, and available operating hours. None of these scenarios is a guarantee.
Finally, keep gross ride revenue separate from profit. Gross revenue does not subtract labor, maintenance, insurance, marketing, facility overhead, financing, or other operating expenses. It also does not equal the FEC’s total revenue, which may include food, arcade play, parties, merchandise, and other attractions. A complete feasibility model should connect the ride-revenue range to contribution margin and the broader facility economics. A design consultation can help evaluate site capacity, demand assumptions, and financial modeling inputs before you commit to a final plan.
Key Variables That Affect First-Year Bumper Car Revenue
Capacity is the starting point, not the forecast. Spin Zone arena designs range from 625 square feet for 5 cars to 1,800 square feet for 15 cars. That difference changes the number of riders you can serve in each session. The amount of queue space you can manage, and how the attraction fits into the rest of the FEC. The right choice depends on available footprint, expected demand, traffic flow, and the experience you want to create.
For the product and footprint context that should sit behind this operating model, see the commercial FEC guide to Spin Zone Bumper Cars. This article stays focused on launch-year operating assumptions and measurement. A separate ROI calculator can handle detailed financial-output scenarios after those inputs are established.
- Confirm the usable footprint, queue, entry, exit, and operator sightlines.
- Map the planned schedule against school breaks, weekends, events, and seasonal demand.
- Document staffing, charging, cleaning, inspection, and maintenance routines.
Review the bumper car arena layout before treating a square-footage figure as usable capacity. A practical plan accounts for entry and exit flow, operator visibility, rider loading, waiting guests, and safe movement around the arena. A larger car count does not automatically produce more first-year revenue if guests cannot move efficiently through the attraction.
Demand and operating schedule
Local demographics, school calendars, tourism, weather, special events, and the attraction mix around the arena all affect demand. A model should separate busy periods from ordinary operating days rather than applying one utilization rate to the entire year. Operating hours matter as well. An attraction open for more hours has more selling opportunities, but only if demand and staffing support those hours. If the schedule extends beyond the periods when guests are available, theoretical capacity can overstate actual results.
Session length and loading efficiency work together. Shorter sessions may create more opportunities to serve riders, while longer sessions may support a different guest experience. The important operating inputs are the actual session time, time required to load and unload, cars available per session, and the number of sessions staff can run consistently. Track these figures by daypart so the revenue model reflects real throughput instead of an idealized maximum.
Uptime, staffing, and venue flexibility
Downtime reduces sellable sessions. Account for routine maintenance, cleaning, inspections, staffing gaps, weather interruptions, and unexpected closures. Battery planning is another operating variable. Spin Zone bumper cars use rechargeable batteries and can run for up to 16 hours between charges. But operators still need a clear charging and maintenance routine that protects availability during peak periods.
Venue flexibility can influence seasonality and utilization. Spin Zone cars require no electric floor and can operate on wood, concrete, asphalt, or ice. That allows an operator to evaluate more venue types and, where the site supports it, consider seasonal or event-based use. These features do not guarantee demand. They expand the operating options that should be tested in a site-specific scenario model.
Finally, keep gross attraction revenue separate from profit and total FEC revenue. A credible first-year model combines site evaluation, capacity planning, staffing, demand, seasonality, downtime, and sales mix, then tests conservative, base, and upside cases.
How Throughput and Session Pricing Impact Annual Revenue
Throughput is the bridge between an attraction’s physical capacity and its annual revenue model. A useful calculation starts with the number of riders served in each session. Then considers how many sessions the team can run during an hour, how many hours the attraction is open, and how consistently guests choose to ride. Session pricing is another operator-supplied input. It belongs in the model, but it should reflect the venue’s audience, market, packages, and sales strategy rather than an assumed industry average.
A simple gross attraction revenue equation is: riders per session multiplied by sessions per hour, operating hours, operating days, utilization, and revenue per rider. If the attraction sells sessions to groups rather than individual riders, use the actual revenue generated by each session. This produces a planning estimate, not a guarantee. It also measures gross attraction revenue, which is different from profit, contribution margin, or total FEC revenue.
| Input | What to measure | Why it matters |
|---|---|---|
| Riders or cars per session. | Seats or cars used during a normal dispatch. | Sets the revenue opportunity each time the attraction runs. |
| Sessions per hour. | Session length plus unloading, loading, and dispatch time. | Shows practical hourly throughput rather than theoretical capacity. |
| Operating hours. | Scheduled attraction hours by weekday and season. | Defines how much selling time is available. |
| Utilization. | Percentage of available capacity filled by actual demand. | Prevents an always-full assumption from overstating results. |
| Operating days. | Days open, including holidays, closures, and seasonal schedules. | Converts daily performance into an annual view. |
| Loading efficiency. | Time required to queue, seat, secure, unload, and reset riders. | Small delays repeated across the day can reduce total sessions. |
| Downtime. | Lost operating time from maintenance, staffing, cleaning, or interruptions. | Separates scheduled capacity from time actually available for rides. |
| Seasonality. | Demand patterns during school breaks, weekends, weather shifts, and slower periods. | Supports realistic monthly assumptions instead of a flat annual average. |
Model scenarios instead of one annual outcome
Build conservative, base, and upside scenarios by changing utilization, session volume, operating days, and operator-supplied session revenue. Keep the physical assumptions visible. For example, a larger dispatch may carry more riders, but poor queue flow can reduce sessions per hour. Conversely, a smaller arena can perform well when loading is organized and demand is scheduled efficiently.
Track actual riders, sessions, average revenue per session, loading time, and downtime after launch. Compare those results with the model by month, since a holiday week should not be treated like a slow weekday. A commercial bumper car operations plan can help the team standardize dispatch and record the operating data needed for better forecasts.
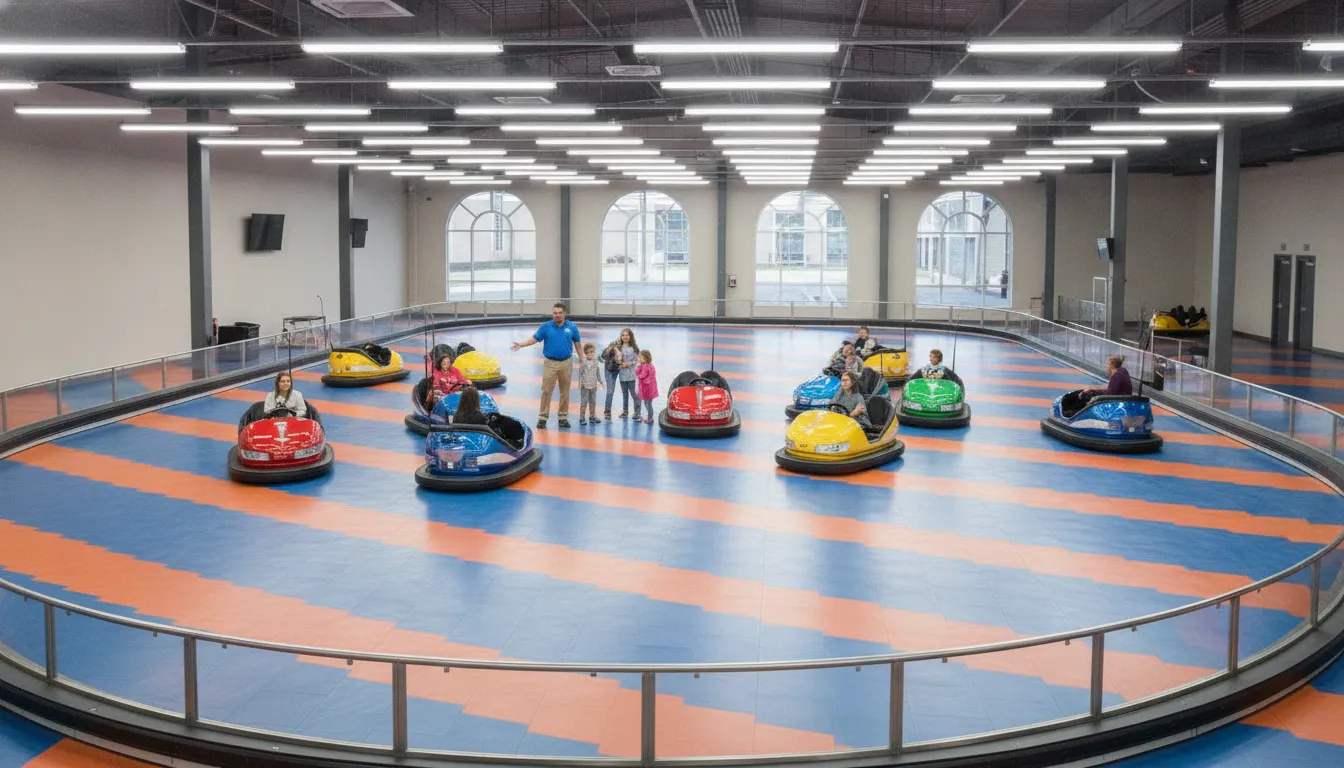
The strongest year-one estimate uses site-specific capacity planning, local demand, staffing realities, and a documented sales mix. It should show where revenue changes when pricing, throughput, or utilization changes, while avoiding the false precision of an unsupported benchmark.
How Can Operators Validate Launch-Year Performance Across FEC Attractions?
Attraction types should not be compared by a headline revenue figure alone. For a useful launch-year evaluation, compare how each option uses floor space, moves guests through the experience. Fits your staffing model, performs across seasons, and supports spending elsewhere in the facility. Those operating dimensions shape the inputs in a site-specific revenue model. This operating comparison is intentionally different from a calculator that produces detailed financial outputs for one attraction.
- Compare usable guest capacity, not just the total footprint.
- Compare dispatch, staffing, maintenance, and downtime requirements.
- Compare weather exposure, seasonality, and the opportunity for repeat play.
- Compare how the attraction supports the full guest itinerary and cross-selling.
Footprint and throughput
Bumper cars can offer a clear capacity planning framework. Spin Zone arena designs range from 625 square feet for five cars to 1,800 square feet for 15 cars. That range allows an operator to evaluate the attraction against available floor space, queue requirements, entry and exit flow, and the desired number of cars per session. Throughput then depends on session length, loading and unloading, operator procedures, and demand rather than arena size alone.
Electric go-karts typically require a course, pit or staging areas, barriers, and additional circulation. That larger operating footprint can support a substantial experience, but it also changes how much of the property is committed to one attraction. Miniature golf spreads play across a course and tends to distribute guests over a longer visit. Pitching machines use compact stations and can create a different pattern of short, repeatable sessions. The right comparison is the number of usable guest sessions a planned footprint can support, not a generic industry average.
Staffing, repeat play, and weather exposure
Each attraction creates a different labor and uptime profile. Bumper cars need trained oversight for dispatch, safety, loading, and session control. Electric go-karts add track operations and pit-flow responsibilities. Miniature golf may require less active dispatch during play, while pitching machines often rely on station monitoring and routine reset procedures. Review staffing alongside peak demand, downtime, maintenance access, and the level of guest assistance your audience needs.
Weather exposure is another important distinction. Spin Zone Bumper Cars do not require an electric floor and can operate on wood, concrete. Asphalt, or ice, which can give an operator more flexibility when evaluating indoor, outdoor, or seasonal placements. Course-based attractions may be more sensitive to weather and daylight, while indoor stations can provide steadier access during poor conditions. Confirm the actual operating environment during feasibility planning rather than assuming every attraction has the same seasonality.
Cross-sell fit within the FEC
Finally, consider how an attraction contributes to the full guest journey. Bumper cars, electric go-karts, miniature golf, and pitching machines can serve different age groups, visit lengths, and competitive preferences. A bumper car session may complement food, arcade play, or another attraction by giving groups a shared activity and a natural reason to continue through the venue. Review the broader framework in FEC attraction revenue benchmarks, then model each option using your own attendance, utilization, staffing, schedule, and sales-mix assumptions.
How Can FEC Operators Validate Bumper Car Attraction Revenue Year One FEC Assumptions?
Strong first-year performance starts with disciplined operations, not an optimistic forecast. Build three scenarios before opening: conservative, base, and upside. For each one, document expected demand, operating days, hours, cars per session, session length, utilization, staffing, downtime, and revenue per participant. Keep gross attraction revenue separate from profit, contribution margin, and total facility revenue. This gives the team a working model that can be updated as actual results replace assumptions.
Design the guest flow before launch
Review the full path from purchase to queue, briefing, loading, ride, unloading, and exit. The queue should be easy to understand without creating conflicts with nearby attractions or blocking emergency access. Define where guests wait, where the operator controls dispatch, and how staff can reset the arena between sessions. A well-planned bumper car arena layout should account for capacity, sightlines, entry and exit movement, parent waiting areas, and local safety requirements.
Staff for consistency, not just coverage
Train attendants on loading instructions, rider eligibility, safety checks, dispatch timing, guest questions, and incident procedures. Then observe the process during both quiet and busy periods. Small variations in loading or unloading can reduce throughput across an entire operating day. A written opening, closing, and inspection checklist helps every shift follow the same standard. The commercial bumper car operations process should be treated as a measurable system, not an informal task.
Measure utilization and downtime every month
Track scheduled hours, available sessions, actual sessions, riders per session, utilization, wait times, cancellations, and equipment downtime. Review the data by daypart, weekday, weekend, school holiday, and season. If demand is strong but utilization is weak, investigate staffing or queue flow before adding capacity. If utilization is low, adjust the schedule, promotion, package design, or operating hours based on evidence. Record maintenance needs early and schedule preventive work during low-demand windows. Rechargeable battery operation can simplify planning, but the team still needs a clear charging, inspection, and service routine.
Use scheduling and packages to raise total venue value
Schedule more sessions when demand is present, then use quieter periods for maintenance, training, and targeted offers. Package bumper car sessions with miniature golf, electric go-karts, pitching machines, or other attractions when the combination improves the guest itinerary and encourages additional participation. Review the package mix and per-capita spending without confusing total FEC revenue with bumper car revenue.
Finally, hold a monthly operating review. Compare each scenario with actual utilization, downtime, staffing performance, demand, and sales mix. For a site-specific plan, Schedule Design Consultation for site evaluation, feasibility analysis, capacity planning, layout development, and financial modeling grounded in your facility.
Schedule a design consultation before you lock in your launch-year assumptions.
Frequently Asked Questions
How should an FEC model first-year bumper car attraction revenue?
Start with operator-supplied assumptions: revenue per participant or session, sessions per operating day, operating days, and an expected utilization factor. Compare theoretical capacity with actual demand, then adjust for loading efficiency, downtime, seasonality, and schedule changes. This produces a planning model rather than a guaranteed result.
What information is needed for a site-specific bumper car revenue model?
Gather the available floor area, planned car count, operating hours, session length, staffing plan, seasonal schedule, traffic patterns, and expected demand. A complete feasibility process can also include site evaluation, demographic studies, capacity planning, layout development, and financial modeling. Source: Amusement Products design consultation.
How do bumper car arena size and capacity affect the model?
A larger arena or higher car count can change theoretical throughput, but it does not automatically create more paid rides. Spin Zone arena designs range from 625 square feet for five cars to 1,800 square feet for 15 cars. The model should test whether the space, demand, loading process, and staffing support the planned capacity. Source: Amusement Products bumper car specifications.
What should operators track after opening?
Track actual riders, sessions, utilization, loading time, downtime, operating hours, seasonality, and sales by daypart. Review those results against the conservative, base, and upside scenarios, then revise the model. Gross attraction revenue should remain separate from profit, contribution margin, and revenue from the rest of the FEC.
Ready to Build a Site-Specific Revenue Model?
A practical feasibility review can turn your operating assumptions into a clearer bumper car attraction revenue model, capacity plan, and first-year scenario analysis. The result is not a promise of performance. It is a structured way to evaluate how the attraction may fit your site, schedule, audience, and operating plan. Schedule Design Consultation to discuss your facility and next planning step with the Amusement Products team.