
For an operator evaluating a new attraction, a go kart track ROI family entertainment center model is not a single number pulled from a brochure. It is the relationship between the capital required to open, the revenue each operating hour can produce, and the costs required to keep the attraction available. A defensible model lets an FEC team compare scenarios before committing to a layout, fleet, and operating plan. For the equipment decision itself, begin with Amusement Products’ commercial electric go-karts guide for family entertainment centers.
Planning a new track or fleet? Speak with Amusement Products’ design consultants about a feasibility-focused concept and custom quote.
This guide provides a practical operating model for owners, developers, and managers. It does not promise a universal payback period. Local demand, ticket structure, facility hours, labor, financing, and the final track design all change the result. The objective is to build a model that exposes those variables, stress-tests them, and gives leadership a clear basis for a go or no-go decision.
What revenue can a go-kart track generate per hour?
Direct answer: Hourly go-kart track revenue equals the number of paid race positions filled during an hour multiplied by the average revenue collected per paid position. The most useful model separates theoretical capacity from actual utilization, because an empty seat or an unfilled race cycle produces no revenue.
Start with the operating mechanics of the attraction rather than a broad annual sales target. Map the race cycle from loading through the end of the guest experience. Then identify how many sellable positions the track can reliably support within that cycle. This gives the team a capacity ceiling that can be compared with observed or forecast demand.
| Input | What it represents | Why it matters |
|---|---|---|
| Sellable positions per cycle | Seats or race entries available after operating rules are applied | Defines maximum demand that can be served |
| Cycles per operating hour | Completed race cycles, including loading and reset time | Shows whether throughput assumptions are realistic |
| Average revenue per paid position | Average collected revenue after the ticket structure is applied | Captures packages, discounts, and mix |
| Utilization rate | Share of sellable positions actually sold | Turns capacity into a demand-based forecast |
A simple planning equation is:
Hourly race revenue = sellable positions per cycle x cycles per hour x utilization rate x average revenue per paid position.
Use this equation for several scenarios, not just a single forecast. A conservative case can reflect slower periods and ramp-up. A base case can reflect the operating plan the management team believes it can deliver. An upside case can show the impact of stronger demand or better capacity management. Keeping the assumptions visible is more valuable than making the model look precise.
Track revenue should also be separated from adjacent spending. A go-kart attraction can contribute to party bookings, food and beverage, arcade, or attraction bundles. But those benefits should be modeled separately so leadership can see whether the track stands on its own and how much incremental spend is truly attributable to it.
Daypart modeling matters more than an annual average. A weekend afternoon can fill every race position while a Tuesday morning runs near zero utilization. Build separate revenue cases for weekday, weekend, and holiday demand, then weight each case by the operating calendar. This exposes where capacity is genuinely constrained and where the ticket or package strategy must compensate.
How do you calculate break-even on a kart fleet investment?
Direct answer: Break-even occurs when the contribution generated by the track covers the capital investment and the operating costs assigned to the attraction. Calculate it by subtracting variable race costs and track-level fixed costs from forecast revenue, then comparing the result with the total project investment.
Build the investment side first. It should include more than the kart fleet. Depending on the project, the complete investment may include track construction, safety systems, charging or fueling infrastructure, design work, permitting, installation, point-of-sale integration, signage, and opening inventory. A team that models only the purchase price of the karts can understate the capital at risk.
Use contribution, not gross sales
Gross sales are useful for measuring demand, but they are not the cash available to recover an investment. For each scenario, estimate the costs that rise when racing volume rises, such as electricity or fuel, consumable parts, payment processing, and activity-specific staffing. Then account for fixed expenses that support the track regardless of whether a particular race sells out.
- Project investment: all one-time costs required to put the attraction into operation.
- Annual track revenue: race revenue plus only the incremental ancillary revenue the team can support.
- Variable operating cost: costs that move with racing activity.
- Fixed track cost: assigned labor, maintenance support, insurance, space-related costs, and other recurring expenses.
- Annual contribution: annual track revenue less variable and fixed track costs.
Simple payback period = total project investment divided by annual contribution. For a more complete investment review, a finance team can apply its required return, financing costs, taxes, depreciation, and a discounted cash-flow analysis. The operating model still matters, because it supplies the assumptions those analyses depend on.
Before choosing a fleet size, review the commercial electric go-kart fleet investment factors that should be included in the project budget.
How to build a go kart track ROI model for your family entertainment center
The most useful go kart track ROI model assembles the revenue engine, the operating cost structure, and the full opening investment into one view. Each part appears in this guide: hourly revenue capacity, contribution after variable and fixed costs, and the complete capital schedule. The skill is connecting them so a change in one area flows through the whole result.
Operators use the finished model in three ways: to pressure-test a proposed investment before signing. To compare fleet and layout options on identical assumptions, and to set operating targets for the first year. Keep the model simple enough that a manager can update it monthly, with a small number of visible assumptions rather than a spreadsheet nobody can audit.
When the model is assembled, run the sensitivity review in the next section. It shows which assumptions deserve the most management attention and where design, staffing, or sales execution creates the largest impact on return.
Which assumptions should an FEC test before approving a track?
Direct answer: Test the assumptions that have the greatest effect on annual contribution: demand by daypart, utilization. Race-cycle time, ticket mix, labor coverage, downtime, maintenance, and the total investment required to open. A useful ROI model shows how the result changes when any one of these inputs changes.
Start with demand by operating period. Weekend peaks, school breaks, group events, and weekday afternoons are not interchangeable. Instead of relying on an annual average, model a weekly operating schedule with distinct dayparts. This makes it easier to identify when capacity is constrained, when staffing is inefficient, and whether a membership or group strategy is needed to support lower-demand periods.
Next, test the impact of operational availability. A track can have strong market demand and still miss its revenue target if it loses race cycles to avoidable resets. Maintenance delays, poor loading flow, or an inappropriate fleet configuration. Amusement Products evaluates long-term operating efficiency and revenue per square foot, not just the up-front equipment decision.
- Set a conservative utilization rate for each daypart.
- Estimate how many completed cycles are achievable during that period.
- Apply the expected ticket and package mix to find average collected revenue.
- Assign variable and fixed track costs.
- Compare the resulting annual contribution with the total project investment.
- Change one assumption at a time to find the model’s most sensitive variables.
This process turns a projection into a management tool. It helps the team decide where better design, staffing, sales execution, or maintenance planning would create the largest improvement in return.
Electric vs. gas kart ROI: what belongs in a five-year model?
Direct answer: A five-year comparison should include the full cost of ownership and the revenue implications of each operating system. Compare initial equipment and infrastructure, energy or fuel, routine maintenance, parts, downtime, staffing workflow, safety controls, and the ability to support the intended guest experience.
A gas-versus-electric discussion should not stop at purchase price. The operating system affects daily procedures and can change how much time the team spends on maintenance, refueling or charging, inspections, and recovery from downtime. It can also affect the track environment, speed-management options, and the operator controls available for different rider groups.
Charging infrastructure deserves its own line in the five-year model. An electric fleet needs a power plan that matches the facility’s electrical capacity. And the installation cost should sit in the opening investment rather than be absorbed into operations. Energy cost per race, routine parts, and scheduled service intervals also become recurring line items in the annual operating statement.
Downtime carries an ROI cost as well. Every race cycle lost to maintenance, charging delays, or recovery procedures removes sellable capacity from the model. The comparison between systems should include the expected time each option keeps karts available at the track, not just the sticker price of the fleet.
For Amusement Products, the relevant comparison is operational as well as financial. Its ThunderVolt Electric Operating System is designed to support safety, control, and performance for commercial electric karting. The company notes that ThunderVolt electric go-karts can save operators more than $35,000 annually compared with gas models. That customer-specific figure should be evaluated against the scope and conditions of an individual project rather than used as a universal forecast.
Use a five-year model with the same operating demand assumptions for both alternatives. Then list the costs and operational implications that differ. This avoids giving one option an artificial advantage through inconsistent revenue assumptions. For a more detailed comparison, see electric go-karts versus gas go-karts for FEC operators.
How can a track improve revenue per square foot?
Direct answer: A go-kart track improves revenue per square foot by reliably converting usable space and operating hours into paid race capacity. Layout efficiency, fleet selection, queue flow, ticket design, uptime, and the mix of individual and group demand all influence that conversion.
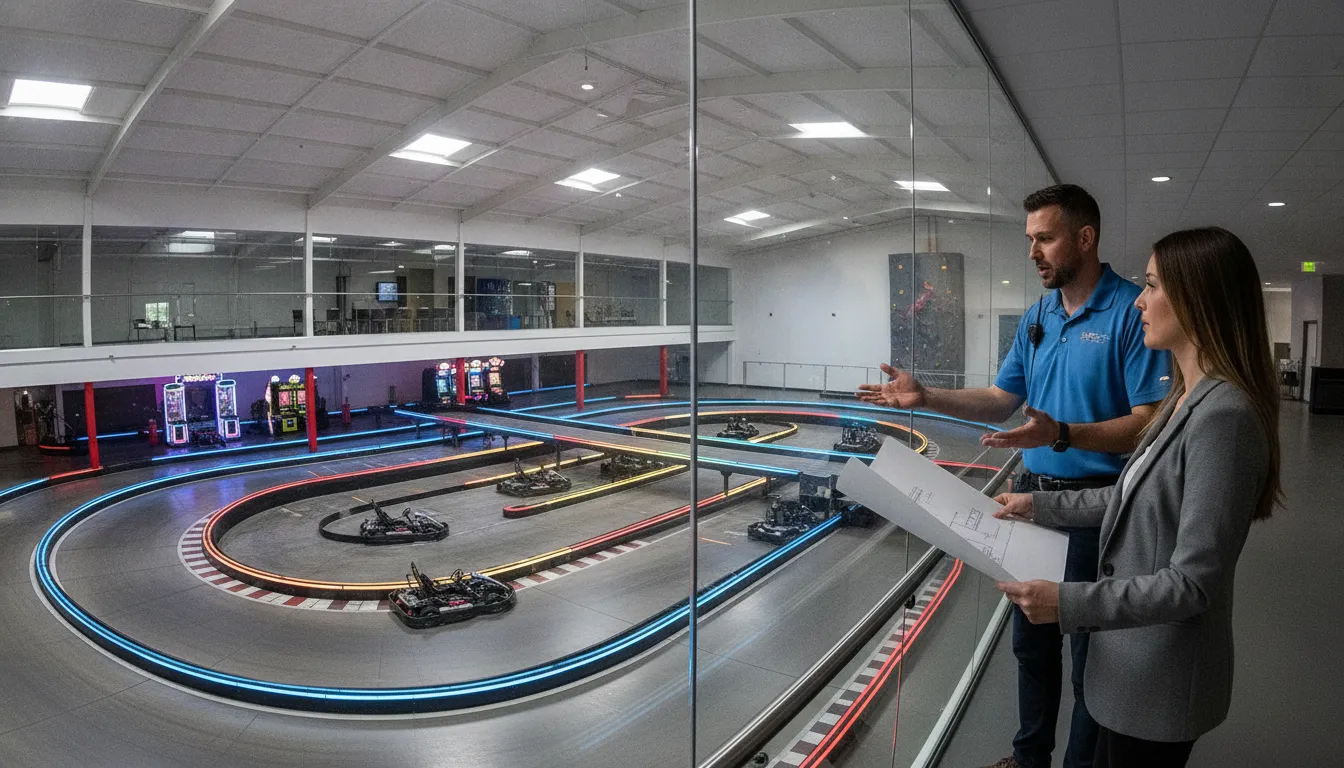
Space planning and financial planning should be connected from the beginning. The layout determines more than visual impact. It shapes loading flow, track capacity, spectator experience, safety zones, and the operational time between races. A layout that looks ambitious but creates avoidable bottlenecks can undermine the ROI model.
- Design for the intended demand: Confirm that the track, fleet, and queue can support the market and ticket strategy.
- Protect race cycles: Standardize loading, briefing, release, and reset procedures so avoidable delays do not consume sellable time.
- Plan for uptime: Treat preventive maintenance and parts planning as revenue protection, not as a back-office expense.
- Use a clear ticket architecture: Measure individual races, packages, memberships, and group programs separately to see which mix supports contribution.
- Coordinate adjacent attractions: Build packages that add value without disguising weak track economics.
Measure the conversion itself rather than relying on an impression. Track completed cycles per hour, average collected revenue per paid position, and utilization by daypart. When those numbers trend up, revenue per square foot follows, and the management team can tie each improvement to a specific operating change.
Track design is a direct operating lever. Amusement Products’ guide to go-kart track layouts that maximize revenue explains why the physical plan should be considered alongside throughput and guest flow.
Is owning a go-kart track profitable?
Direct answer: A go-kart track can be profitable when its location, demand, operating model. And cost structure support enough annual contribution to recover the investment and meet the operator’s required return. Profitability cannot be determined from equipment price or ticket price alone.
The right question is not whether karting is profitable in the abstract. It is whether a specific track in a specific FEC can produce reliable contribution under conservative operating assumptions. That requires a model grounded in the local market, the planned facility mix, actual hours, and a realistic view of staffing and maintenance.
Operators should also distinguish between a good opening period and durable performance. A track that performs well after launch still needs a plan for repeat visitation, group sales, seasonal demand, fleet availability, and ongoing management attention. A disciplined KPI review keeps the team focused on the inputs it can improve rather than simply reacting to monthly revenue totals.
Work with Amusement Products to maximize track ROI
Amusement Products brings more than 60 years of experience in the family entertainment industry and provides commercial electric go-karts, track design, construction, and consultation services. The company approaches karting as an operating attraction, where performance, control, safety, durability, and revenue potential must work together.
If you are evaluating a new track, contact Amusement Products for a custom consultation to align your facility concept, fleet, and operating assumptions before finalizing the investment.
For broader launch planning, read the complete guide to starting a go-kart business. For construction budgeting, review the factors that shape go-kart track construction costs. Together, these resources can help your team move from an initial idea to a decision-ready business case.
Frequently asked questions about go-kart track ROI
How much money does it take to open a go-kart track?
The required investment varies by site, track format, fleet, infrastructure, construction needs, permitting, and the operating systems selected. Build a project-specific budget that includes the entire opening scope, then compare it with conservative annual contribution scenarios.
How much should an FEC charge for go-karting?
Pricing should reflect the local market, track experience, operating costs, capacity, and package strategy. In an ROI model, use average collected revenue per paid race position rather than a single published ticket price so discounts and packages are represented accurately.
What is the most important go-kart track KPI?
There is no single KPI that replaces a complete operating view. Revenue per operating hour, utilization, completed cycles, contribution margin, downtime, and average collected revenue per paid position should be monitored together.
Why does track uptime affect ROI?
Every unavailable kart, delayed race cycle, or unplanned maintenance event reduces the sellable capacity of the attraction. Preventive maintenance and appropriate operational controls protect the revenue assumptions built into the investment model.